I recently had the opportunity to play with a data analytics platform called LYNXeon by a local company (Austin, TX) called 21CT. The LYNXeon tool is billed as a “Big Data Analytics” tool that can assist you in finding answers among the flood of data that comes from your network and security devices and it does a fantastic job of doing just that. What follows are some of my experiences in using this platform and some of the reasons that I think companies can benefit from the visualizations which it provides.
Where I work, data on security events is in silos all over the place. First, there’s the various security event notification systems that my team owns. This consists primarily of our IPS system and our malware prevention system. Next, there are our anti-virus and end-point management systems which are owned by our desktop security team. There’s also event and application logs from our various data center systems which are owned by various teams. Lastly, there’s our network team who owns the firewalls, the routers, the switches, and the wireless access points. As you can imagine, when trying to reconstruct what happened as part of a security event, the data from each of these systems can play a significant role. Even more important is your ability to correlate the data across these siloed systems to get the complete picture. This is where log management typically comes to play.
Don’t get me wrong. I think that log management is great when it comes to correlating the siloed data, but what if you don’t know what you’re looking for? How do you find a problem that you don’t know exists? Enter the LYNXeon platform.
The base of the LYNXeon platform is flow data obtained from your various network device. Regardless of whether you use Juniper JFlow, Cisco NetFlow, or one of the other many flow data options, knowing the data that is going from one place to another is crucial to understanding your network and any events that take place on it. Flow data consists of the following:
- Source IP address
- Destination IP address
- IP protocol
- Source port
- Destination port
- IP type of service
Flow data also can contain information about the size of the data on your network.
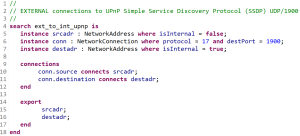
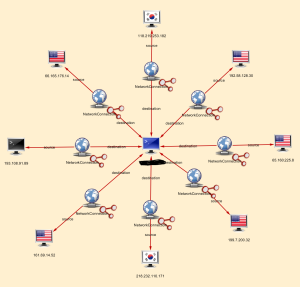
The default configuration of LYNXeon basically allows you to visually (and textually) analyze this flow data for issues which is immediately useful. LYNXeon Analyst Studio comes with a bunch of pre-canned reporting which allows you to quickly sort through your flow data for interesting patterns. For example, once a system has been compromised, the next step for the attacker is often times data exfiltration. They want to get as much information out of the company as possible before they are identified and their access is squashed. LYNXeon provides you with a report to identify the top destinations in terms of data size for outbound connections. Some other extremely useful reporting that you can do with basic flow data in LYNXeon:
- Identify DNS queries to non-corporate DNS servers.
- Identify the use of protocols that are explicitly banned by corporate policy (P2P? IM?).
- Find inbound connection attempts from hostile countries.
- Find outbound connections via internal protocols (SNMP?).
It’s not currently part of the default configuration of LYNXeon, but they have some very smart guys working there who can provide services around importing pretty much any data type you can think of into the visualizations as well. Think about the power of combining the data of what is talking to what along with information about anti-virus alerts, malware alerts, intrusion alerts, and so on. Now, not only do you know that there was an alert in your IPS system, but you can track every system that target talked with after the fact. Did it begin scanning the network for other hosts to compromise? Did it make a call back out to China? These questions and more can be answered with the visual correlation of events through the LYNXeon platform. This is something that I have never seen a SIEM or other log management company be able to accomplish.
LYNXeon probably isn’t for everybody. While the interface itself is quite easy to use, it still requires a skilled security professional at the console to be able to analyze the data that is rendered. And while the built-in analytics help tremendously in finding the proverbial “needle in the haystack”, it still takes a trained person to be able to interpret the results. But if your company has the expertise and the time to go about proactively finding problems, it is definitely worth looking into both from a network troubleshooting (something I really didn’t cover) and security event management perspective.


